Setting up alerts
This guide explains how to set up alerts to notify you when user defined anomalies are found in your data.
Introduction
Set up alerts to trigger email notifications when anomalies are detected in your data in the administration section of Explore & Present. Anomalies are values that are outside of a defined boundary, which are also known as outliers.
Alerts are based on metric values and when a value exceeds or falls below a set limit, the alert triggers a notification. Apply filters and conditions to an alert to configure when a notification is sent. During an alert set up, preview the data to check if the configuration matches your expectations.
The alert notifications are sent by email at 8am CEST.
Accessing the Alert page
To access the Alert page to set up alerts, follow these steps:
-
In the , click Explore.
-
In the , under Explore, click Alerts.
If you cannot see the Alerts option, the lack of access is due to the role (or roles) to which you have been assigned. For more information on user permissions and roles, see Changing user permissions in Explore & Present.
Setting up alerts
To set up alerts, follow these steps:
-
Access the Alert page. To access the alert page, follow the Accessing the Alert page procedure.
-
In the top right corner of the Alert page, click the + New Alert button.
-
Fill in the following fields:
-
Name
-
Enter a name for the alert.
-
Date range
-
Choose the date range for the data displayed in the Data preview field. To select a static date range, select the Fixed option. To select a dynamic date range, choose the date range options that best match your criteria, such as This week or Last x days.
-
Dimension filter
-
Apply a dimension filter to the alert. Choose from one of the following options:
-
Click
 Add dimension filter to create a new dimension filter. For more information, see Adding a dimension filter to the widgets.
 -
Click
 Load filter template to apply an existing dimension filter to the alert.
-
-
Metric
-
Choose the metric on which to base the alert.
-
Granularity
-
Choose the time granularity for the alert. For example, to configure the alert to look for anomalies on a day-by-day basis, select Daily.
-
Condition type
-
Choose the anomalies that trigger the alerts. Anomalies are values that are outside of a defined boundary, which are also known as outliers. Choose from one of the following options:
-
Fixed Boundaries - Select this option to provide a set of fixed boundaries. Any value above and below these fixed boundaries triggers a notification. For more information on configuring fixed boundaries, see Alerts with fixed boundaries.
-
Outliers By Moving Mean - Select this option to provide dynamic boundaries based on the mean (average) data value. This option makes the boundaries follow any trends in your data. For more information on configuring dynamic boundaries, see Alerts with a moving mean.
-
-
Data preview
-
Display a preview of your data with a gray area mapped onto the graph. This gray area is also known as a window and indicates the boundaries of the selected Condition type. Any data points that fall outside of the defined boundaries are highlighted in red. See below for an example of the Data preview field.
-
Frequency
-
Select the frequency of alert notifications. Choose from one of the following options:
-
Fire for every value - A notification is sent for each value found outside of the boundaries.
-
Fire at most once - Only one notification is sent when the first outlier is found.
-
Fire once for all consecutive outliers - A notification is sent for each series of outliers. A series of outliers contains a consecutive set of data points outside of the boundaries.
See the example for each of the frequency options below:
In the following scenario, an alert is created to trigger a notification for values greater than 10. At the end of a week, different frequency options result in different number of alerts you receive. The following data import highlights these different frequency options:
-
Monday: 8
-
Tuesday: 11
-
Wednesday: 13
-
Thursday: 5
-
Friday: 11
-
Saturday: 14
-
Sunday: 16
The alert Frequency options work as follows:
-
Fire for every value - 5 alerts in total are sent for Tuesday, Wednesday, Friday, Saturday and Sunday.
-
Fire at most once - Only 1 alert is sent.
-
Fire once for all consecutive outliers 2 alerts in total are sent - one alert for the series of outliers across Tuesday and Wednesday, and another alert for the series of outliers across Friday to Sunday.
-
-
Send as Email
-
Enter the email address to which the notifications are sent. Enter multiple email addresses to send out alerts to multiple emails. Select the Send to my email checkbox to send alerts to the email address associated with your Adverity account.
-
Enable / Disable Alert
-
Select the Enable Alert checkbox to enable the alert upon creation. Disable alerts to stop sending notifications.
-
-
Click Create.
As a result, Adverity creates an alert and starts to check for outliers based on the alert criteria.
Alerts with fixed boundaries
Alerts with fixed boundaries notify you when a value is found above or below the fixed boundaries.
To configure alerts with fixed boundaries, set Condition type to Fixed boundaries, and fill in the following fields:
-
Lower
-
Enter a value for the lower fixed boundary. If you do not want a lower boundary, clear the checkbox next to the Lower field. The example of a Data preview with fixed boundaries in the figure below has a lower boundary set to 3000. All values below 3000 are displayed in red and trigger an alert notification.
-
Upper
-
Enter a value for the upper fixed boundary. If you do not want an upper boundary, clear the checkbox next to the Upper field. The example of a Data preview with fixed boundaries in the figure below has an upper boundary set to 18000. All values above 18000 are displayed in red and notify you with ann= alert.
See an example of a Data preview for an alert with fixed boundaries below.
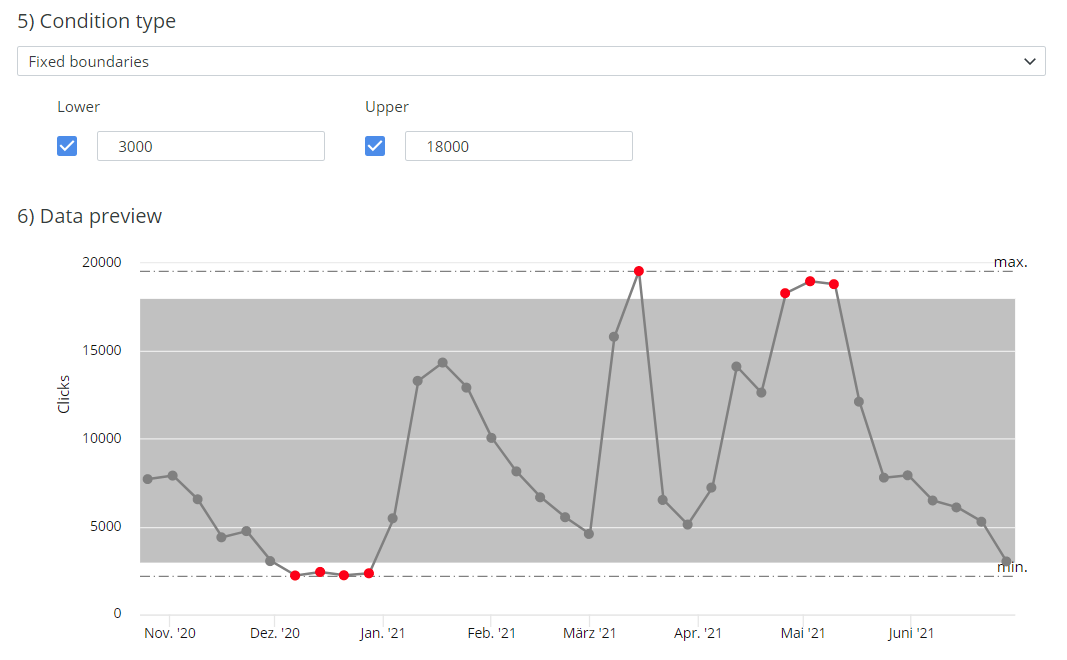
An example of a Data preview for an alert with fixed boundaries. The data points in the gray area do not trigger an alert. The red data points trigger an alert.
Alerts with a moving mean
Alerts with boundaries around a moving mean notify you when a value is found above or below the dynamic boundaries. This option makes the boundaries follow any trends in your data. To configure alerts with dynamic boundaries, set Condition type to Outlier By Moving Mean, and fill in the following fields:
-
Outlier percentage
-
Select the percentile boundaries for the moving mean window. For example, with an Outlier percentage of 10, any value that is 90% larger or smaller than the mean value is considered an outlier.
-
Use bounds
-
Select to use either an upper boundary, a lower boundary, or both. By default, the option both is selected.
-
Window Size
-
Select how many values are used to calculate the mean value. A bigger window size makes the mean more accurate and the window boundaries smoother.
-
Mean method
-
Select how the mean is calculated. Choose between an average value of all data points or the median value of all data points.
-
Cold start
-
Select this checkbox to calculate the mean using all data points in the selected time frame.
To calculate the mean using only full window sizes, clear the Cold start checkbox. For example, a data set covers 29 weeks, and the Window size is set to 5. There are only five complete window sizes in the data set. The mean calculation does not include the first two weeks and last two weeks of data.
See an example of a Data preview for an alert with dynamic boundaries around a moving mean below.
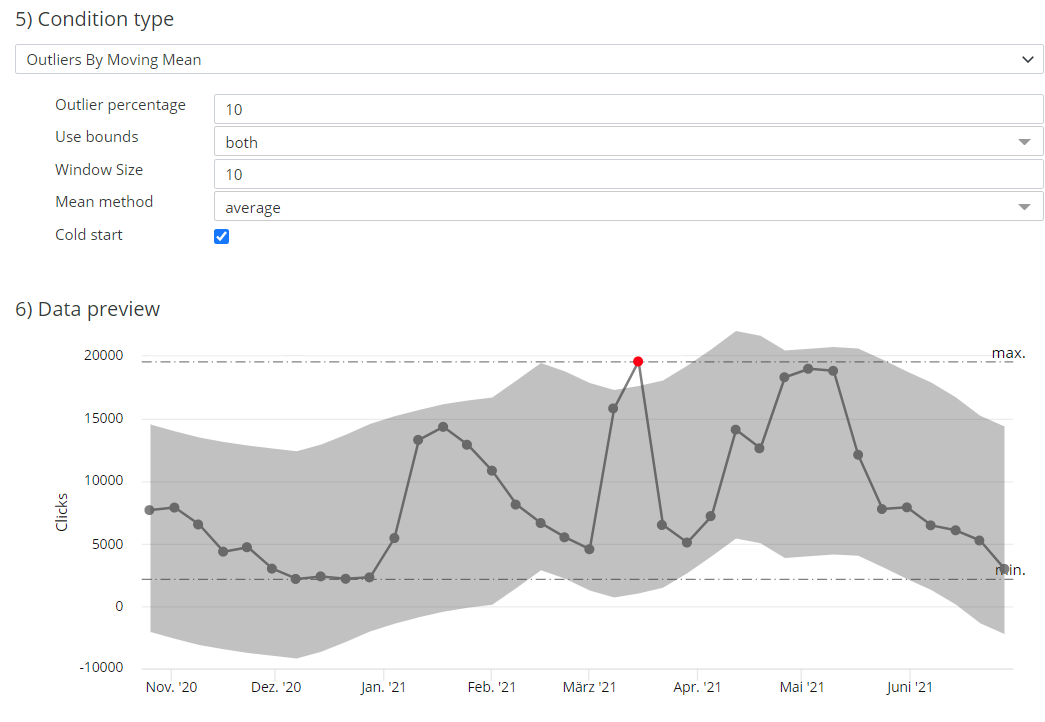
An example of a Data preview for an alert with dynamic boundaries around a moving mean. The data points in the gray area do not trigger an alert. The red data points trigger an alert.