Creating a dashboard with filters
This guide explains how to create a dashboard with filters.
Introduction
Filter data in s and dashboards to display only the information that you find relevant.
This guide uses the example of a Facebook Ads and a Google Ads datastream. The procedure described below is similar in all other datastreams.
Concept
There are two types of filter:
-
filters
-
Use filters to filter data at the level of individual s. For more information, see Creating widgets with filters and conditional formats.
-
Dashboard filters
-
Use dashboard filters to filter data at the level of dashboards and dashboard pages.
For more information about the different ways to filter data in Explore & Present, see Filter types in Explore & Present.
Prerequisites
Before you complete the procedure in this guide, perform all of the following actions:
-
Create a Facebook Ads datastream. For more information, see Collecting data from Facebook Ads.
-
Create a Google Ads datastream. For more information, see Collecting data from Google Ads.
-
Apply the correct Data Mapping for your datastreams. For more information, see Introduction to harmonizing data.
-
Make sure that your data extracts contain the following fields:
-
campaign_name -
impressions
-
Creating a simple dashboard
Creating s
To create s, follow these steps:
-
In the , click Explore.
-
Select the workspace you work with in Explore & Present.
-
Next to the View tabs at the top of the page, click
 Create new view.
 -
In the Dimensions panel, click Datasource to see the options for this field. Click Remove.
-
In the list in the , select a dimension. This guide uses Campaign Name as an example.
-
In the list in the , select a metric. This guide uses Impressions as an example.
-
In the table that you have created in the middle of the page, click on one of the values in the Impressions column to see visualization options. Click All Campaign Names.
Adding the s to a dashboard
To add the s that you have created to a dashboard, follow these steps:
-
In the top right of the page, click Add to a dashboard.
-
Click
 Add as a table.
 -
In the pop-up window, select Add to new draft dashboard. Name your new dashboard and click Add.
-
At the top of the page, go back to the View tab that contains the s you have created.
-
In the top right of the page, click Add to a dashboard.
-
Click
 Add as a visualization.
 -
In the pop-up window, select Add to existing dashboard. From the drop-down menu, select the dashboard that you have created.
-
Select Add to existing page. From the drop-down menu, select the first dashboard page.
-
Click Add.
Viewing the dashboard
To view the dashboard, follow these steps:
-
In the , click Present.
-
Select the workspace you work with in Explore & Present.
-
Click the dashboard that you have created.
Naming the s
To name the s, follow these steps:
-
In the top left corner of the table , click the title of the , and rename it to Table - Impressions by campaign.
-
In the top left corner of the chart , click the title of the , and rename it to Chart - Impressions by campaign.
Filtering data in a dashboard page
Adding a date range quickfilter to the dashboard page
To continue the procedure above and add a date range quickfilter to the dashboard page, follow these steps:
-
In the top right corner of the page, click
 Permanent Filters and Quickfilters.
 -
Click
 Date range quickfilter on page.
-
In the Select widgets field, select Table - Impressions by campaign.
-
In the date picker, select the date range.
-
Click Apply.
As a result, the table only displays data for the selected date range. The chart is not affected by this filter.
The quickfilter appears on the page as a . Anyone with view access to the dashboard can interact with this .
Setting the default date range for the page-level quickfilter
To set the default date range for the page-level quickfilter you have created, follow these steps:
-
Hold the pointer over the quickfilter, and then click
 Widget settings in the top right corner.
 -
Click
Set quickfilter default.
As a result, when you or a viewer loads the dashboard, they first see this default date range applied in the quickfilter. They can interact with the quickfilter and temporarily change this date range.
Adding a dimension quickfilter to the dashboard page
To continue the procedure above and add a dimension quickfilter to the dashboard page, follow these steps:
-
In the top right corner of the page, click
Permanent Filters and Quickfilters. -
Click
Dimension quickfilter on page. -
In the Select widgets field, select Chart - Impressions by campaign.
-
In the Choose dimension drop-down menu, select Campaign Name.
-
In the Filter by drop-down menu, select three campaign names.
-
Click Apply.
As a result, the chart only displays data for the selected campaigns. The table is not affected by this filter.
The quickfilter appears on the page as a . Anyone with view access to the dashboard can interact with this .
For more information, see Configuring dashboard page-level dimension quickfilters.
Filtering data in several pages in a dashboard
Cloning the page in the dashboard
To clone the page in the dashboard, follow these steps:
-
In the top right corner of the page, click
 Clone.
 -
Click Clone page.
-
In the drop-down menu, select the dashboard where you are currently.
-
Click Clone to selected dashboard.
As a result, Adverity creates an exact copy of your dashboard page within the same dashboard.
Naming the dashboard pages
To name the dashboard pages, follow these steps:
-
Using the arrows in the top right corner, go to the first dashboard page.
-
In the top left corner of the page, click the title of the page, and rename it to Data from Facebook Ads.
-
Go to the second dashboard page.
-
In the top left corner of the page, click the title of the page, and rename it to Data from Google Ads.
Adding a date range quickfilter to the dashboard
To continue the procedure above add a date range quickfilter to the dashboard, follow these steps:
-
In the top right corner of the page, click
Permanent Filters and Quickfilters. -
Click
Date range quickfilter on dashboard. -
In the Select pages field, select Data from Facebook Ads.
-
In the date picker, select the date range.
-
Click Apply.
As a result, s in the Data from Facebook Ads dashboard page only display data for the selected date range. The Data from Google Ads dashboard page is not affected by this filter.
The quickfilter appears as a header on the top of the Data from Facebook Ads dashboard page. Anyone with view access to the dashboard can interact with this header.
Setting the default date range for the dashboard-level quickfilter
To set the default date range for the dashboard-level quickfilter you have created, follow these steps:
-
In the date picker in the quickfilter header, select the date range.
-
Click
Edit dashboard quickfilter. -
Click
Set as default.
As a result, when you or a viewer loads the dashboard, they first see this default date range applied in the quickfilter. Anyone with view access to the dashboard can interact with the quickfilter and temporarily change this date range.
Adding a dimension quickfilter to the dashboard
To continue the procedure above and add a dimension quickfilter to the dashboard, follow these steps:
-
In the top right corner of the page, click
Permanent Filters and Quickfilters. -
Click
Dimension quickfilter on page. -
In the Select pages field, select Data from Google Ads.
-
In the Choose dimension drop-down menu, select Campaign Name.
-
In the Filter by drop-down menu, select three campaign names.
-
Click Apply.
As a result, s in the Data from Google Ads dashboard page only display data for the selected campaigns. The Data from Facebook Ads dashboard page is not affected by this filter.
The quickfilter appears as a header on the top of the Data from Google Ads dashboard page. Anyone with view access to the dashboard can interact with this header.
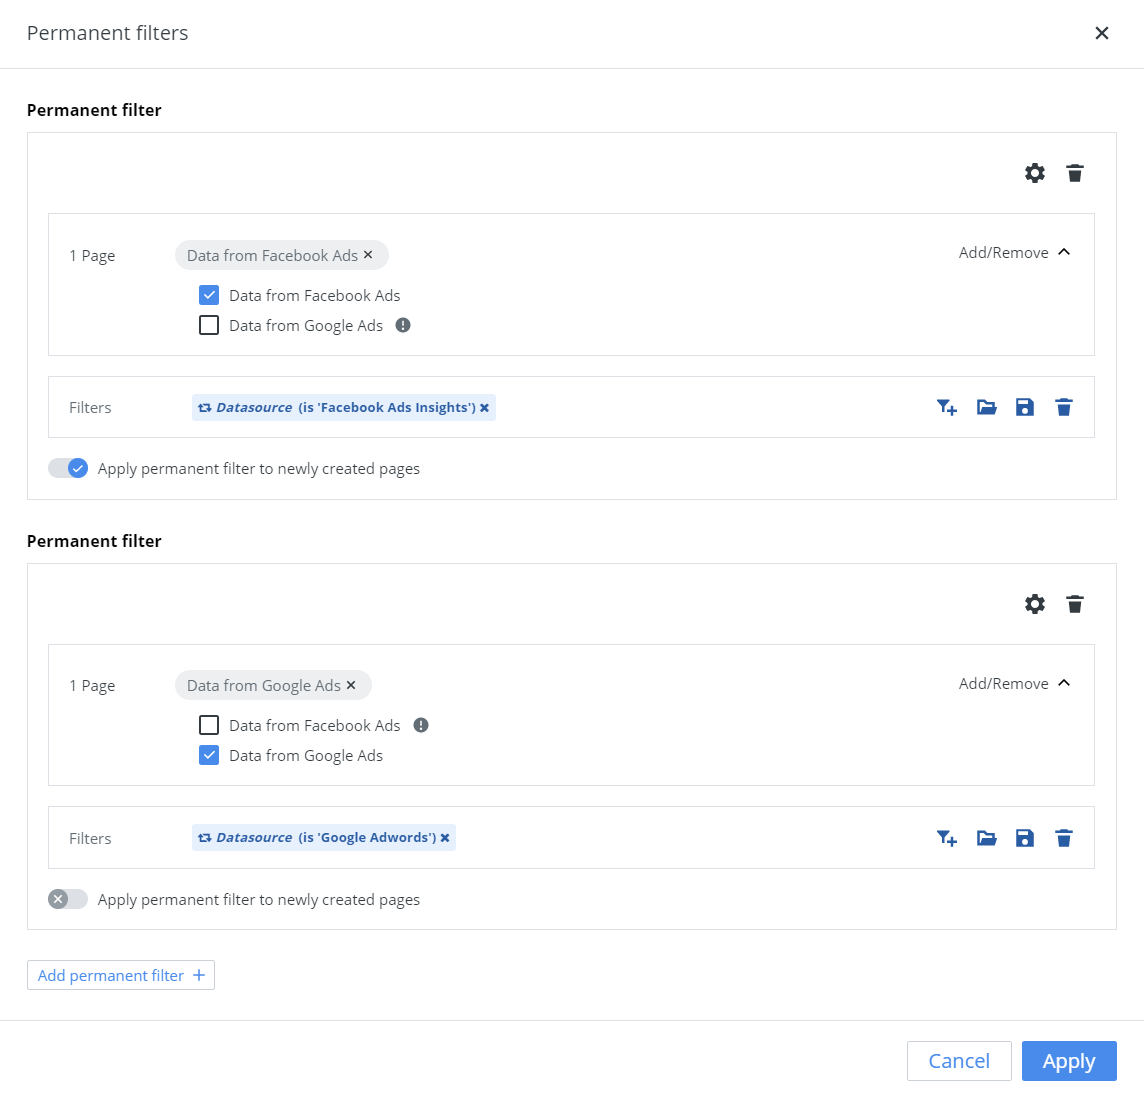
Adding permanent filters to the dashboard
To continue the procedure above and add permanent filters to the dashboard, follow these steps:
-
In the top right corner of the page, click
Permanent Filters and Quickfilters. -
In the menu, click
Permanent filter. -
In the All pages section, click Add/Remove.
-
Select the checkbox for Data from Facebook Ads. Clear the checkbox for Data from Google Ads.
-
In the Filters section, click
 Add dimension filter.
 -
In the Choose dimension drop-down menu, select Datasource.
-
In the Filter by drop-down menu, select Facebook Ads Insights.
-
Click Add permanent filter +.
-
In the All pages section of the second permanent filter, click Add/Remove.
-
Clear the checkbox for Data from Facebook Ads. Select the checkbox for Data from Google Ads.
-
In the Filters section, click
Add dimension filter. -
In the Choose dimension drop-down menu, select Datasource.
-
In the Filter by drop-down menu, select Google Adwords.
-
Click Apply.
-
Click Apply again.
Adding permanent filters to a dashboard
You have achieved the following:
-
s in the Data from Facebook Ads dashboard page only display data from Facebook Ads.
-
s in the Data from Google Ads dashboard page only display data from Google Ads.
Combining and dashboard filters
In this guide, you set up both and dashboard filters.
By default, Adverity displays data in s if it satisfies the criteria of both filters at the same time. This combination of filter criteria relies on intersection (AND) logic. It narrows down the data that Adverity displays, and you see less data.
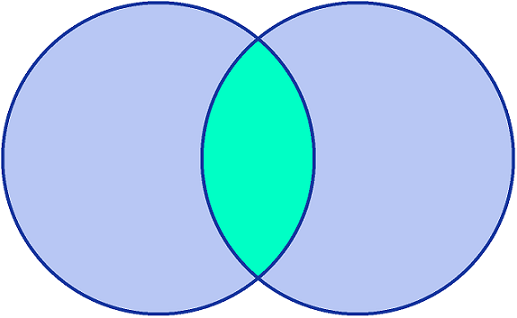
Intersection logic
To specify how Adverity combines the criteria of filters and permanent filters, follow these steps:
-
In the top right corner of the page, click
Permanent Filters and Quickfilters. -
In the menu, click
Permanent filter. -
In the Permanent Filters window, in the All pages section, click
Settings. -
In the Combine filter criteria window, select Show more data (OR).
-
Click Apply.
-
Click Apply again.
As a result, Adverity displays data in s if it satisfies the criteria of at least one of the two filters. This combination of filter criteria relies on union (OR) logic. It extends the data that Adverity displays, and you see more data.
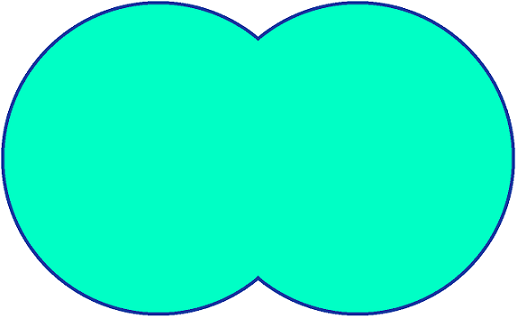
Union logic