Using the Plan page
This article provides an overview of the Plan page and outlines its functionality.
Introduction
The Plan feature or Campaign Monitoring optimizes the planning and reporting of your campaigns. You can compare the planned budget, impressions, clicks, or any other campaign metric to your campaigns' current, real-time data. You can also compare planned and delivered data of campaigns that have finished.
In addition, you can add this comparison information in the form of a to a dashboard in the Present page.
Adding the Plan page to Adverity
If you do not have the Plan page in your Adverity and wish to add it, follow these steps:
-
Contact the Adverity Account Management team and request the Plan page.
-
Set up the Plan page with the help of the Adverity Implementation team.
As a result, the Implementation team integrates your media plan, and the Plan page is added to your Adverity instance.
Understanding Plan visualization
The primary purpose of the Plan page is to display your campaign's goals side by side with the current data your campaign is receiving. This data is displayed in a table . Your initial table can be similar to the following:
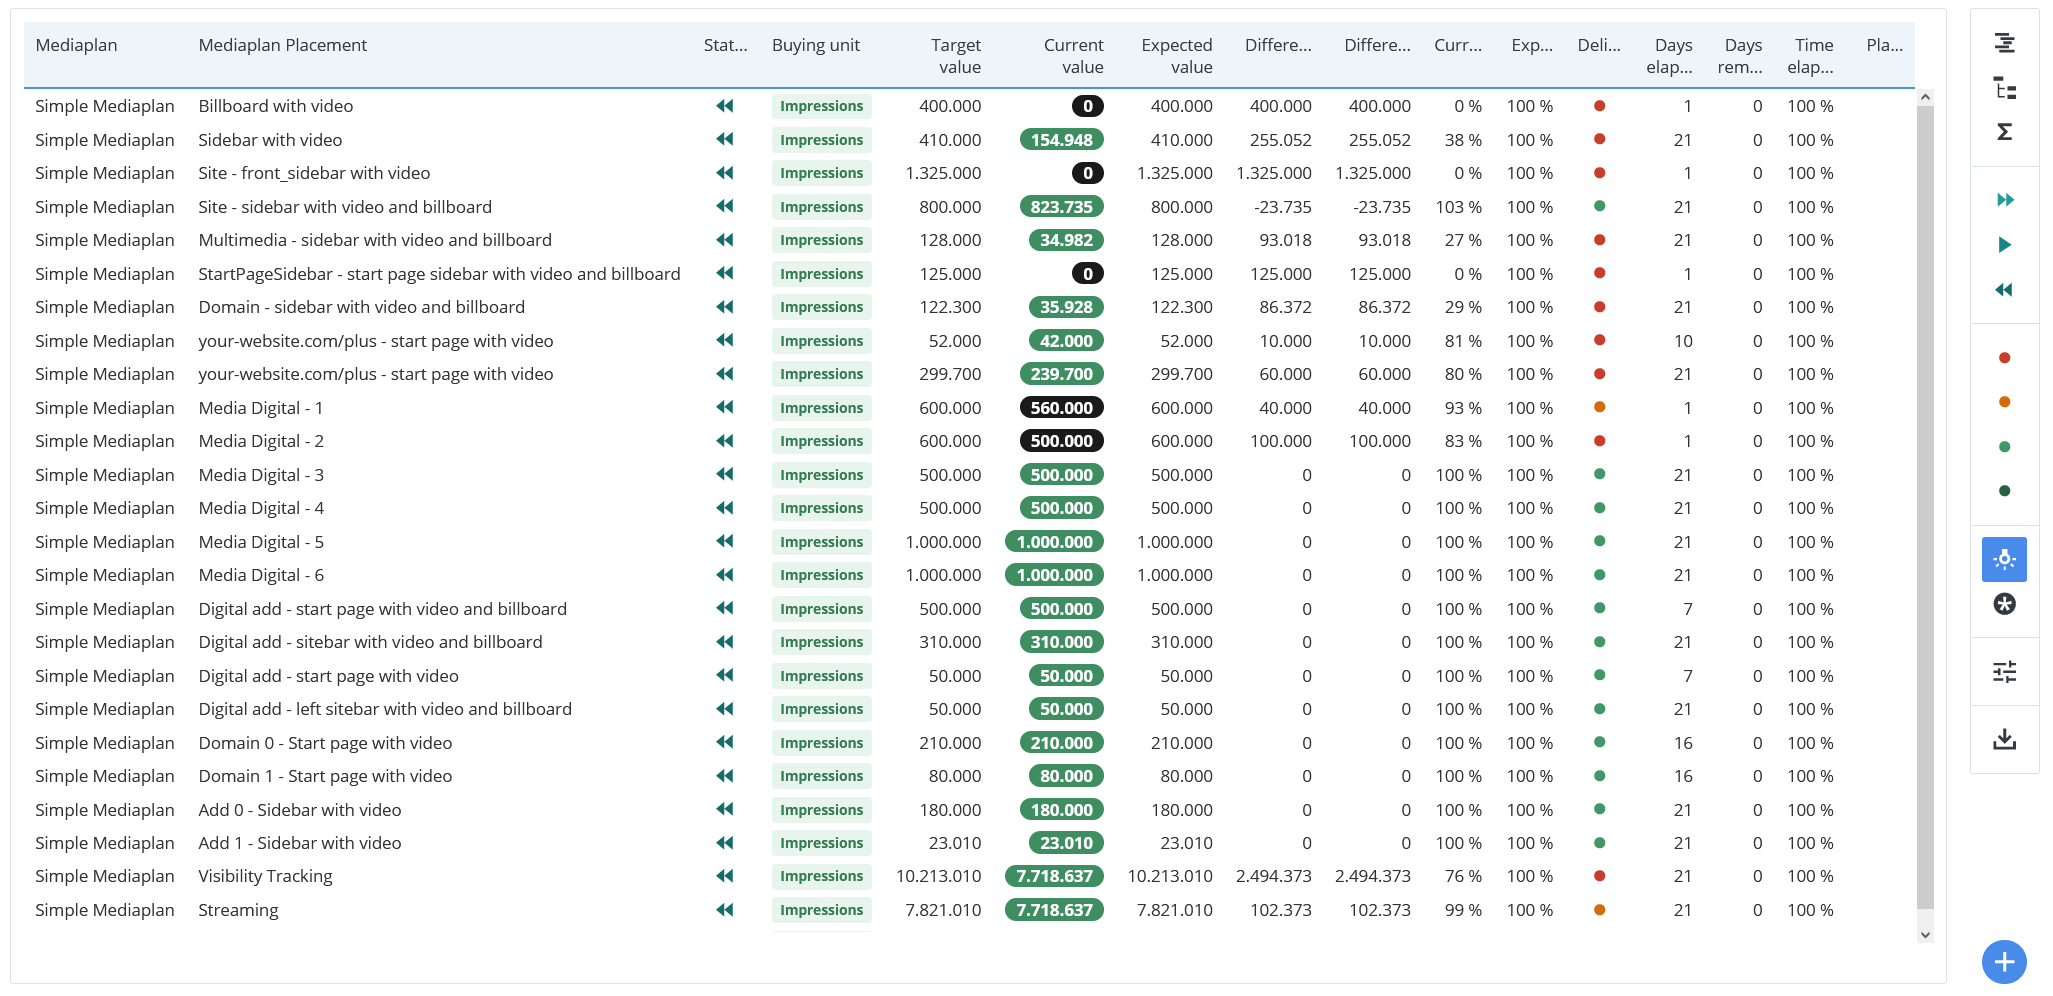
The media plan configuration in the Plan page
Filtering columns
To filter for specific columns, follow these steps:
-
Select the workspace you work with in Adverity and then, in the , click Explore.
-
In the , click Plan.
-
Above the Plan preview, click Column filters.
-
In the expanded Column filters section, click
 Add.
Add. -
In the left drop-down list, select a specific column to filter for. Metrics are displayed in green and dimensions are displayed in blue.
-
In the right drop-down list (Filter by...), select specific strings or numbers to filter for.
-
(Optional) For dimension values, click on the selected dimension value to cycle through different filtering modes for a specific string. The available options are the following:
-
is
-
contains
-
starsWith
-
endsWith
-
-
(Optional) Click Exclude to exclude filtered values from your .
Filtering columns in the Plan page
Creating your own conditional styling
Conditional styling enables you to highlight selected metric values with specified conditions. Plan page includes default conditional styling. However, you can overwrite these stylings.
To create your own conditional formatting, follow these steps:
-
Select the workspace you work with in Adverity and then, in the , click Explore.
-
In the , click Plan.
-
Above the Plan preview, click Conditional styling.
-
Click
Add conditional format. -
In the expanded Conditional styling section, in the left drop-down list, select a metric. In this guide, we are using Target value for demonstration purposes.
-
From the central drop-down list, select an operator. For example, select > to highlight everything larger than set value.
-
From the right drop-down list, type in the numeric value. For example, enter 100 000 to highlight displayed Target value above 100 000.
-
Click
 Font color and
  Background color to change the conditional styling.
 -
(Optional) Make the font bold by clicking the B icon.
-
(Optional) Add arrows beside the displayed values by clicking the Indicator icon.
Displaying data in a gantt visualization
To display data in the Plan in a gantt chart, follow these steps:
-
Select the workspace you work with in Adverity and then, in the , click Explore.
-
In the , click Plan.
-
In the right options panel next to the preview, click
 Gantt.
Displaying data in a gantt visualization in the Plan page
Adding a Plan to a dashboard
To add the Plan to a dashboard, follow these steps:
-
Select the workspace you work with in Adverity and then, in the , click Explore.
-
At the top of the page, select the View tab that contains the .