Using calculated KPIs
This reference article explains how to use calculated KPIs in your s.
Introduction
Calculated key performance indicators (calculated KPIs) are metrics calculated based on other metrics. Calculated KPIs are often the sum or the ratio of other metrics. For example, the cost per click (CPC) calculated KPI is the ratio of the costs metric and the clicks metric. Other examples are cost per mille (CPM) and the conversion rate.
Adverity displays calculated KPIs in the Explore page in green with the ![]() sign.
sign.
Do not retrieve Calculated KPIs from data sources. Aggregating calculated KPIs from different data sets can result in incorrect data. Instead, collect the component metrics and let Adverity compute the calculated KPI based on the component metrics.
Creating calculated KPIs
Create custom calculated KPIs to perform calculations on existing metrics and add the results of the calculations to a . The example below explains how to create a calculated KPI that expresses cost per click (CPC) values. The calculated KPI created in this example is identical to the default CPC calculated KPI offered by Adverity.
To create a calculated KPI, follow these steps:
-
In the , click Explore.
-
Select the workspace you work with in Explore & Present.
-
In the Metrics section of the view, click
 Create new calculated KPI.
 -
In the Select Metrics to add to formula below field, select a metric to calculate with, and then click + Add Metric.
-
Repeat step 3 for all metrics you want to calculate with. This example selects the Costs and Clicks metrics.
-
In the Formula field, use mathematical operators to specify the calculation between the metrics you have selected. This example adds a division sign
/between the metrics:(costs)/(clicks)In the Calculated formula box, you will see the full formula and automatic validation status.
-
In Calculated KPI Name, write a name for the calculated KPI.
-
If the calculated KPI expresses a percentage, currency, or duration, select the appropriate option in Format. In this example, select Currency because cost per click is a monetary measurement.
-
In Visibilities, select the workspaces which have access to the calculated KPI. Select a workspace group to grant access to all of its child workspaces.
-
Click Create calculated KPI.
The calculated KPI is ready to use and you can add it to a . For more information on creating s with calculated KPIs, see Creating widgets with calculated KPIs.
Creating calculated KPI with complex formulae
The example above explained how to create a calculated KPI where the Formula field only contains the following basic mathematical operators:
-
addition
+ -
subtraction
- -
multiplication
* -
division
/
It is possible to specify more complex formulae, such as conditional statements and average calculations.
Using conditions in formulae
Specify the condition in the Formula field in the following way:
CASE WHEN {condition} THEN {calculation1} ELSE {calculation2} END
In the code above, replace the following:
-
Replace
{condition}with a conditional statement. Use basic mathematical operators and the following:OR,AND,IS NULL,NULLIF. -
Replace
{calculation1}with the value of the calculated KPI if the condition is satisfied. -
Replace
{calculation2}with the value of the calculated KPI if the condition is not satisfied.
For example, if you use the formula CASE WHEN (clicks)>100 THEN (costs)/(clicks) ELSE (costs)*0.01 END in the example above, Adverity computes the calculated KPI in the following way:
-
If the number of clicks for a campaign is greater than 100, the CPC value is the ratio of costs and clicks.
-
If the number of clicks is less or equal to 100, the CPC value is 1% of the costs.
Conditions used to compute calculated KPI can include dimensions as well as metrics.
For example, if you use the formula CASE WHEN dimensions->'week' IS NULL AND (clicks)<100 THEN 0 ELSE 1 END in the example above, Adverity computes the calculated KPI in the following way:
-
If the week dimension is null and the number of clicks for a campaign is less than 100, the calculated KPI value is set to 0.
-
If the week dimension is not null or the number of clicks is equal to or greater than 100, the calculated KPI value is set to 1.
Using dimensions in formulae
Generally, you can only use metrics in the formula because you cannot perform calculations on the values of a dimension. One exception is that you can calculate the unique values in a dimension. To do so, use the following code: COUNT(DISTINCT({dimension})), replacing {dimension} with the name of the dimension whose unique values you want to count.
For example, the code COUNT(DISTINCT({campaign_name})) calculates the number of unique campaign names.
Performing calculations on the table's data in formulae
To perform a calculation on the table's data in the Formula field, use the following expressions:
-
To calculate the average of a metric's values, use
AVG({metric-name}). Replace{metric-name}with the metric's name. -
To calculate the sum of a metric's values, use
SUM({metric-name}). Replace{metric-name}with the metric's name. -
To compute a function differently for all distinct combinations of dimension values, use
OVER (PARTITION BY 0)after the function. -
To compute a function differently for all distinct combinations of dimension values, excluding the last dimension, use
OVER (PARTITION BY 1)after the function. -
To compute a function differently for all distinct combinations of dimension values, excluding a number of dimensions at the end of the list, use
OVER (PARTITION BY {number-of-dimensions-to-exclude})after the function. Replace{number-of-dimensions-to-exclude}with the number of dimensions to exclude. -
To compute a function for all rows without splitting data for any dimensions, use
OVER()after the function.
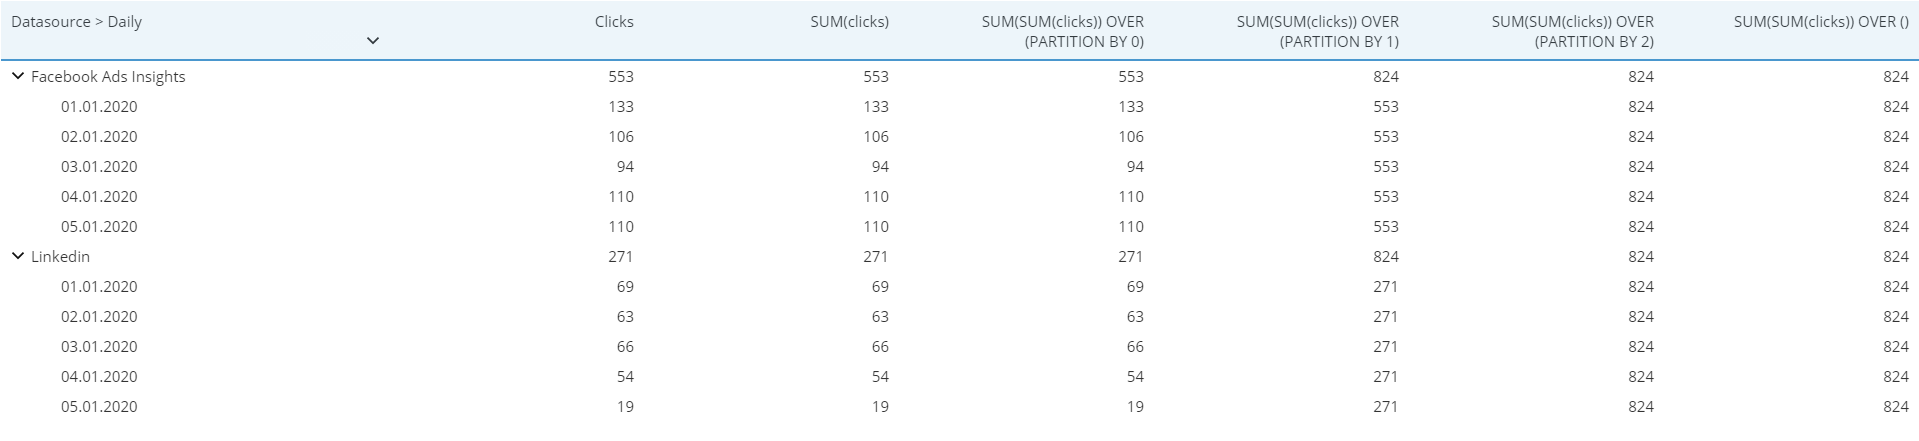
In this example, from left to right, the following fields are represented in a table:
-
The dimensions Datasource and Daily.
-
The metric Clicks.
-
The calculated KPIs with the formulae
SUM(clicks)andSUM(SUM(clicks)) OVER (PARTITION BY 0). In these columns, every row calculates the sums of clicks for each day and each data source. For example, it displays clicks on Facebook Ads for a particular day. The result is the same as the values in the Clicks column. -
The calculated KPI with the formula
SUM(SUM(clicks)) OVER (PARTITION BY 1). In this column, every row calculates the sums of clicks per data source, without splitting data by day. This is why the number of clicks per day is the same within each data source. -
The calculated KPIs with the formulae
SUM(SUM(clicks)) OVER (PARTITION BY 2)andSUM(SUM(clicks)) OVER (). In these columns, every row calculates the total sum of clicks, without splitting data by data source and day. This is why the number of clicks is the same for all rows.
Use the following formula to calculate the difference from the average cost:
(costs) - AVG(SUM(costs)) OVER (PARTITION BY 1)